What is the Audience Overview Report?
If you have never signed into your Google Analytics Account, the entire dashboard can seem overwhelming! The first report you will see is the Audience Overview Report, and at first glance, the metrics can seem confusing. What is the difference between users and sessions? What is a bounce rate, and is my score good or bad? Here at MarketKeep, a digital marketing agency for small businesses and start-ups, we rely on the Audience Overview Report to supply us with a quick snapshot of how our digital marketing efforts are going. So we put together this blog, to help outline the Audience Overview Report for Small Businesses and Start-ups in the hopes that it makes logging into Google Analytics a little less scary.
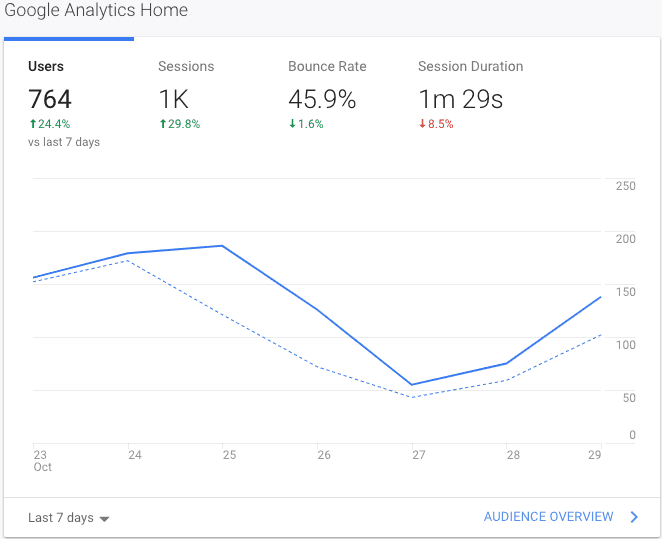
The photo above outlines what your typical Audience Overview Report will look like for small businesses. It provides you with a graph of the number of sessions performed by website users. This is important information that you can gather on a weekly, monthly yearly, or a custom time frame. If you click on the blue button for Audience Overview, Google Analytics will take you deeper into the Audience Overview Report where you will find the following information:
Overview – The top level view of user metrics
Demographics – The age and gender makeup of your website audience
Interests – User behavior segmented by affinity and marketing categories
Geo – The languages and locations of your website audience
Behavior – Comparisons of new and returning visitors, how often return visits occur and how long visitors spend on your website
Technology – The browsers, operating systems, and networks of your website visitors
Mobile – A breakdown of devices used to access your website
Custom – Reports defined by you or your marketing agency
User Flow – A visualization of how users move through your website.
Overview – Audience Overview Report
The audience overview is generally what you see when you first click on the audience overview report. At the top of the overview tab is a graph which outlines the number of sessions performed by website users. This graph can toggle between hourly, day, week, and month.

Beneath this graph are what Google identifies as your top-level session details showing you the number of users, who have performed sessions on your website, page views, pages per session, average session duration, bounce rate, and the percentage of new sessions.

The bottom part of the overview tab in your report showcase quick links to your top demographics, system and mobile data, and a chart showing the number of sessions on your website from visitors speaking a particular language.

Demographics – Audience Overview Report
The demographics tab in your audience overview report breaks down your visitors by their age and gender.
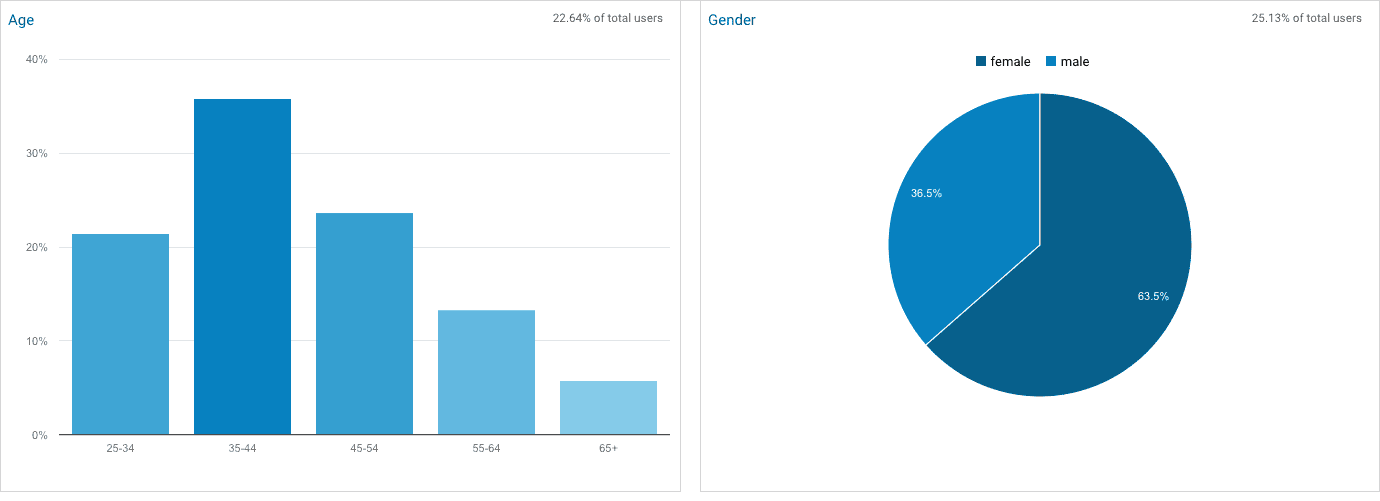
The default view for Demographics gives you a broad view of the age and gender of your visitors, Google Analytics does provide an in-depth analysis of your demographics in the full age and gender category reports. By accessing this data, a website owner can find out which age groups and gender are most likely to respond to his or her content. This information is helpful in placing both digital & traditional advertising pieces in the future.
Interests – Audience Overview Report
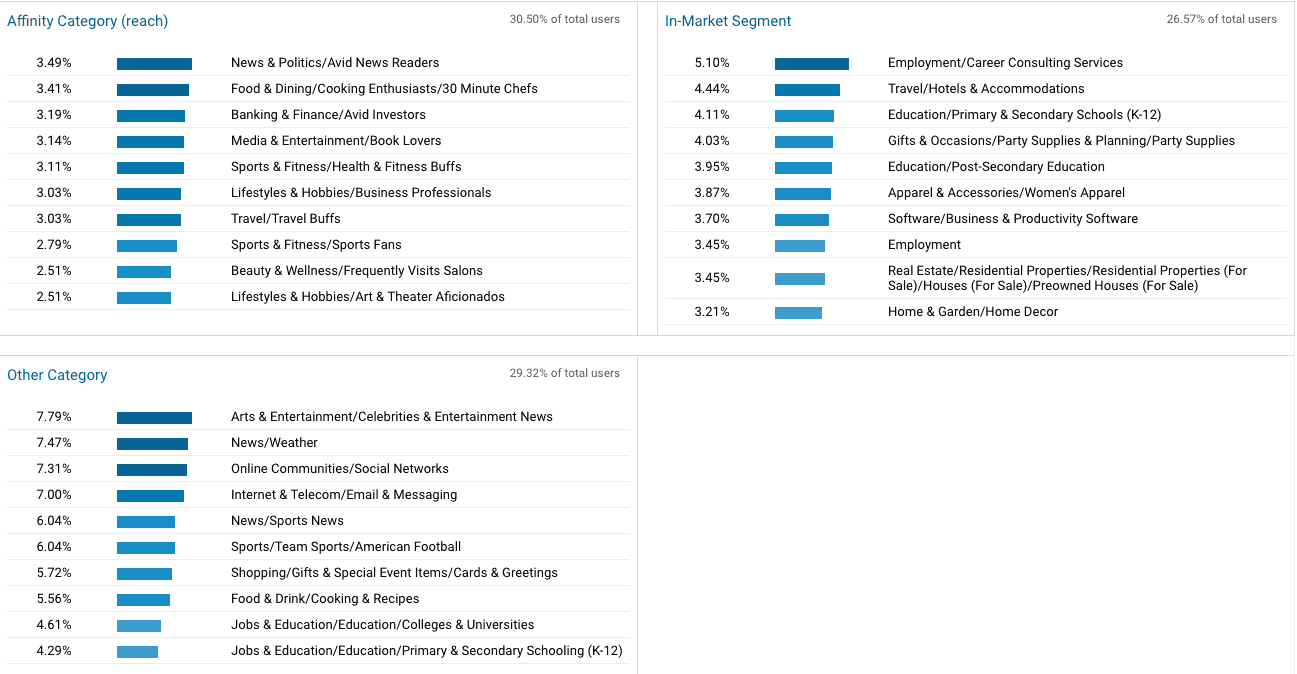
Google Analytics provides website owners the ability to see what your visitors are interested in, in addition to your website. There are three types of categories that Google Analytics Provides users with. They are:
Affinity – A category used to reach potential customs to make them aware of your brand or product. The affinity category is designed to target users at the top of your sales funnel.
In-market Segment – The in-market segment users are more likely ready to purchase or use your services, and are users who would be considered lower in the purchase funnel. AKA at the end of the buying cycle.
Other Category – This is a more granular category, and lets you identify users who are not associated with Affinity or In-Market Segments
Geo – Audience Overview Report
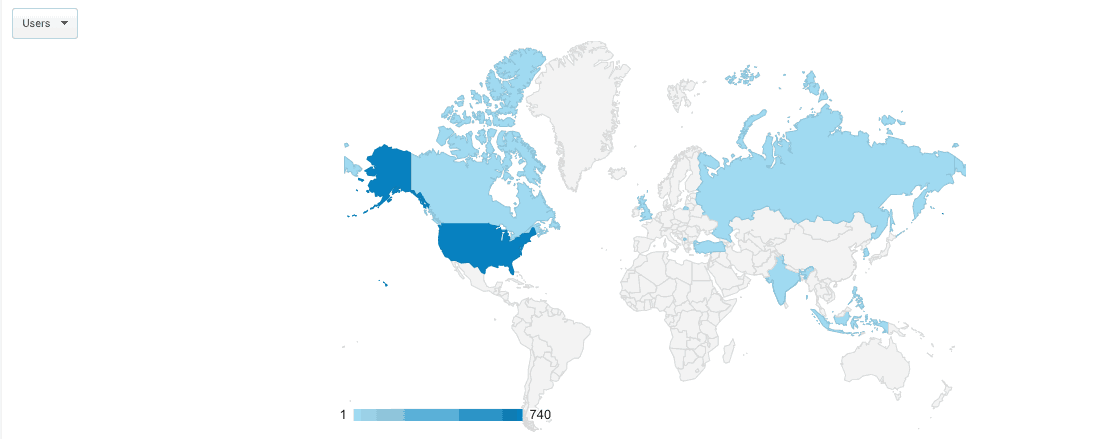
The geography section of your audience overview report outlines the languages and locations of your website visitors. Google Analytics also provides users with an interactive map in this section so that they can identify areas closer to the store, state view, country, view, and even a worldview of users.
Behavioral – Audience Overview Report
The behavioral section of the Audience Overview Report includes details on the habits of your users as they visit your website. This section of Google Analytics provides users with information such as New versus Returning Vistors, Frequency & Recency & Engagement. Having this information allows you to figure out how aggressive to be in your marketing. If you find that most conversions happen on your website on the first visit, versus the sixth visit that does allow you to consider how you should advertise.
